jsPlumb使用指南
jsPlumb使用指南
12月 23, 2017
·
3 分钟阅读时长
·
1503
字
·
-阅读
-评论
最近项目需要实现可视化绘制DAG即有向无环图,经过几个方案的调研,最终选择了jsPlumb.
jsPlumb本身分Tookit付费版及Community社区版,因核心功能社区版都已具备,且开源社区本身的活跃度更为方便未来的开发维护等,所以选择社区版。

学习渠道
学习一个技术,官方文档,官方社区,谷歌搜索,是你最需要依重的.
这里啰嗦,贴下地址
除了这些官方资料,看一些博文也能有不小帮助,正如我这里写的,愿能帮到你些。
使用
我的实际项目前端框架是Angular,所以这里代码是是在此背景下的写法,但应不怎么影响大家去借鉴,毕竟思维,理念都差不都,毕竟都是JS。
先了解jsPlumb绘图的几个概念
端点 端点,是指,我们图上可以有几个连出去或者连进来的可视化点
锚点
锚点指的是端点可以最终落下的位置,也就意味着,一个端点,可以指定多个锚点位置,根据实际的图形位置,灵活落在某个锚点上。
连线 我们通过连接建立多个Window即节点之间的关联,比如我们用贝塞尔曲线,还是流程图那种的折线,这些就需要设定连接器
覆盖物 解决绘制与连接之上的UI问题,比如标签,或者箭头等
强调:其实,很多时候,很容易误解锚点和端点的概念,我也走了点弯路
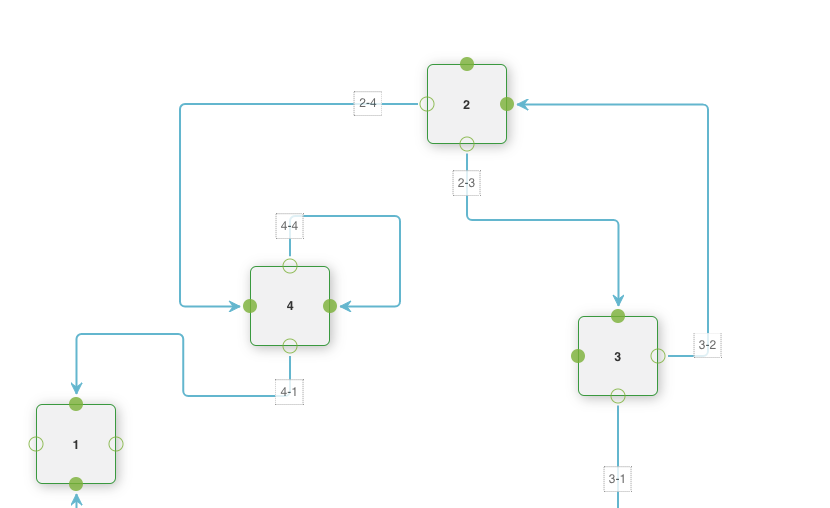
上例子
已实现功能
- 动态添加节点
- 动态删除节点
- 动态连边
- 动态删边
- 节点拖拽监听
- 节点及边,右键菜单
第三方组件jquery.contextMenu实现
Show me the code
import {Component, ElementRef, OnInit, Renderer2, ViewChild} from '@angular/core';

declare let jsPlumb: any;
declare let $: any;

@Component({
    selector: 'app-jsplumb',
    templateUrl: './jsplumb.component.html',
    styleUrls: ['./jsplumb.component.css']
})
export class JsplumbComponent implements OnInit {


    jsPlumbInstance: any;
    @ViewChild('canvas') public panel: ElementRef; // 画板


    constructor(private renderer: Renderer2) {
    }

    ngOnInit() {
        this.draw();
    }

    draw() {
        this.jsPlumbInstance = jsPlumb.getInstance({
            // default drag options
            DragOptions: {cursor: 'pointer', zIndex: 2000},
            // the overlays to decorate each connection with.  note that the label overlay uses a function to generate the label text; in this
            // case it returns the 'labelText' member that we set on each connection in the 'init' method below.
            ConnectionOverlays: [
                ['Arrow', {
                    location: 1,
                    visible: true,
                    width: 11,
                    length: 11,
                    id: 'ARROW',
                    events: {
                        click: function () {
                            alert('you clicked on the arrow overlay')
                        }
                    }
                }],
                ['Label', {
                    location: 0.1,
                    id: 'label',
                    cssClass: 'aLabel',
                    events: {
                        // connection.getOverlay("label")
                        tap: function () {
                            let label = prompt('请输入标签文字:');
                            this.setLabel(label);
                        }
                    }
                }]
            ],
            Container: 'canvas',
            ConnectionsDetachable: true
        });
        const basicType = {
            connector: ['Bezier', {curviness: 100}],
            paintStyle: {stroke: 'red', strokeWidth: 4},
            hoverPaintStyle: {stroke: 'blue'},
            overlays: [
                'Arrow'
            ]
        };

        this.jsPlumbInstance.registerConnectionType('basic', basicType);

        // 支持拖拽
        this.jsPlumbInstance.draggable('flowchartWindow1');
        this.jsPlumbInstance.draggable('flowchartWindow2');
        this.jsPlumbInstance.draggable('flowchartWindow3');
        this.jsPlumbInstance.draggable('flowchartWindow4');


        // 增加端点
        this.jsPlumbInstance.addEndpoint('flowchartWindow1', sourceEndpoint);
        this.jsPlumbInstance.addEndpoint('flowchartWindow2', targetEndpoint);

        // listen for clicks on connections, and offer to delete connections on click.
        //
        this.jsPlumbInstance.bind('click', function (conn, originalEvent) {
            // if (confirm("Delete connection from " + conn.sourceId + " to " + conn.targetId + "?"))
            //   instance.detach(conn);
            // conn.toggleType('basic');
            console.log(conn);
            console.log(originalEvent);
        });

        //
        this.jsPlumbInstance.bind('connection', (connInfo) => {
            this.addMenu4Edge(connInfo);
            console.log(connInfo);
        });

        this.jsPlumbInstance.bind('connectionDetached', (connInfo) => {
            console.log(connInfo);
        });

        this.jsPlumbInstance.bind('connectionDrag', function (connection) {
            console.log('connection ' + connection.id + ' is being dragged. suspendedElement is ', connection.suspendedElement, ' of type ', connection.suspendedElementType);
        });

        this.jsPlumbInstance.bind('connectionDragStop', function (connection) {
            console.log('connection ' + connection.id + ' was dragged');
        });

        this.jsPlumbInstance.bind('connectionMoved', function (params) {
            console.log('connection ' + params.connection.id + ' was moved');
        });
        this.jsPlumbInstance.bind('click', (connection, e) => {
            this.jsPlumbInstance.detach(connection);
        });

    }

    /**
     * 边添加右键菜单
     */
    addMenu4Edge(connInfo) {
        connInfo.connection.addClass(connInfo.connection.id);
        const removeEdge = (v) => {
            console.log(connInfo);
            let cons = this.jsPlumbInstance.getConnections('*', {source: connInfo['sourceId'], target: connInfo['targetId']});
            this.jsPlumbInstance.deleteConnection(cons[0]);
        };
        $.contextMenu({
            selector: '.' + connInfo.connection.id,
            callback: function (key, opt, event) {
                console.log(`event`);
                console.log(event);
            },
            items: {
                'cut': {
                    name: '删除',
                    icon: 'cut',
                    callback: function (key, opt) {
                        removeEdge(key);
                    }
                }
            }
        });
    }

    /**
     * node添加右键菜单
     * id=nodeProgram-5
     */
    addMenu4Node(nodeId: string) {
        let removeNode = (v) => {
            this.jsPlumbInstance.remove(nodeId);
        };

        $.contextMenu({
            selector: '#' + nodeId,
            callback: function (key, opt, event) {
                console.log(`event`);
                console.log(event);
            },
            items: {
                'cut': {
                    name: '删除',
                    icon: 'cut',
                    callback: function (key, opt) {
                        removeNode(key);
                    }
                }
            }
        });
    }

    addNode() {
        // 图表添加节点信息
        const div = this.renderer.createElement('div');
        div.id = 'flowchartWindow5';
        div.innerHTML = `<strong>结束5</strong><br/><br/>`;
        div.setAttribute('class', 'window jtk-node');
        this.renderer.appendChild(this.panel.nativeElement, div);

        this.jsPlumbInstance.addEndpoint('flowchartWindow5', sourceEndpoint);

        // 支持拖拽,拖拽
        this.jsPlumbInstance.draggable($(div), {
            drag: function (event) {
                console.log(event);
            },
            start: function (event) {
                console.log(event);
            }
        });

        // 右键菜单
        this.addMenu4Node(div.id);
    }

    /**
     * 删除边
     */
    removeEdge() {
        let cons = this.jsPlumbInstance.getConnections('*', {source: 'flowchartWindow1', target: 'flowchartWindow2'});
        this.jsPlumbInstance.deleteConnection(cons);
    }

}

const anchors = [[1, 0.2, 1, 0], [0.8, 1, 0, 1], [0, 0.8, -1, 0], [0.2, 0, 0, -1]];

const connectorPaintStyle = {
        strokeWidth: 2,
        stroke: '#61B7CF',
        joinstyle: 'round',
        outlineStroke: 'white',
        outlineWidth: 2
    },
    // .. and this is the hover style.
    connectorHoverStyle = {
        strokeWidth: 3,
        stroke: '#216477',
        outlineWidth: 5,
        outlineStroke: 'white'
    },
    endpointHoverStyle = {
        fill: '#216477',
        stroke: '#216477'
    },

// the definition of source endpoints (the small blue ones)
    sourceEndpoint = {
        endpoint: 'Dot',
        paintStyle: {
            stroke: '#7AB02C',
            fill: 'transparent',
            radius: 7,
            strokeWidth: 1
        },
        isSource: true,
        connector: ['Flowchart', {stub: [40, 60], gap: 10, cornerRadius: 5, alwaysRespectStubs: true}],
        connectorStyle: connectorPaintStyle,
        hoverPaintStyle: endpointHoverStyle,
        connectorHoverStyle: connectorHoverStyle,
        dragOptions: {},
        overlays: [
            ['Label', {
                location: [0.5, 1.5],
                label: 'Drag',
                cssClass: 'endpointSourceLabel',
                visible: false
            }]
        ]
    },
    // the definition of target endpoints (will appear when the user drags a connection)
    targetEndpoint = {
        endpoint: 'Dot',
        paintStyle: {fill: '#7AB02C', radius: 7},
        hoverPaintStyle: endpointHoverStyle,
        maxConnections: -1,
        dropOptions: {hoverClass: 'hover', activeClass: 'active'},
        isTarget: true,
        overlays: [
            ['Label', {location: [0.5, -0.5], label: 'Drop', cssClass: 'endpointTargetLabel', visible: false}]
        ]
    };
总结
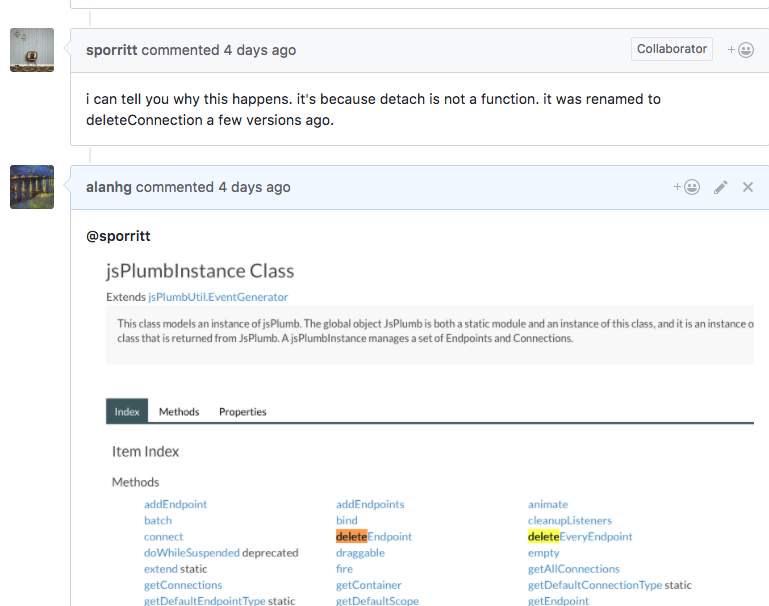
jsPlumb相对其它绘图方案已经成熟,如果不想自己重新造轮子,使用这个可以满足所需,当然实际使用上,个人认为官方Doc还是不算完善,有时看的莫名其妙,有时还有错误。
比如删边,其实函数名称叫deleteConnection,如下图:


