最近项目需要实现前端流程图绘制,于是进行一次系统的技术调研,包括echarts,highcharts,jsPlumbs,jointJS,RaphaelJs,d3等。echarts,highcharts由于本身就没有很好的流程图模型,更适合柱状图,饼状图等,所以直接pass,其它的,经过对比,最终敲定了D3。
摘录一篇博文中的榜单,作者将这些流程图类库进行了总结,可以看出D3还是很厉害的。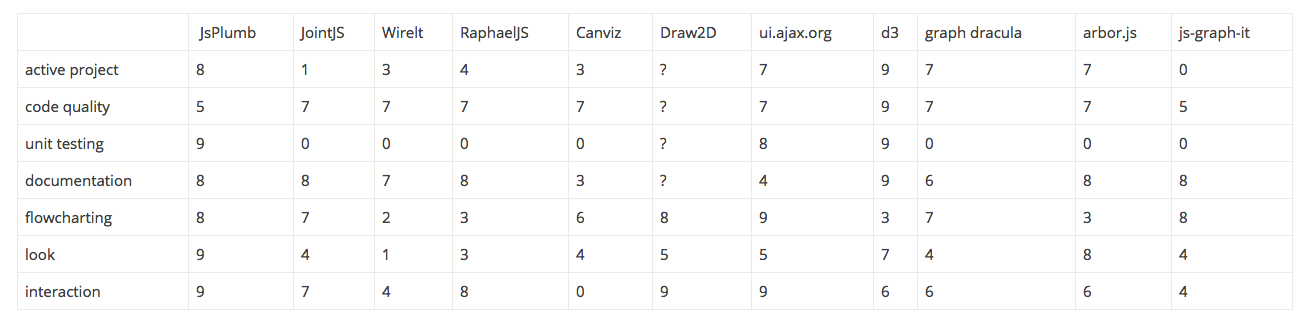
决定用D3之后,如果直接D3来写,未免过于辛苦,查了一遍,找到了基于D3的类库-dagre-d3.在使用中,随着不断的深入,对于这个类库有了充分的了解,百度还是谷歌,觉得资料都太少了,尤其中文, 这里,将其总结下。
dagre-d3-你需要知道的几点
干嘛的?
Dagre是一个能够在客户端轻松创建流程图的JavaScript类库,而dagre-d3可以理解为是Dagre的前端,它使用D3来进行渲染。
项目活跃度
dagre-d3能够有1K+的星星数,说明这个类库还是很受欢迎的,但是无论是dagre还是d3-dagre已经处于非活跃状态,作者本人已经不再维护了。
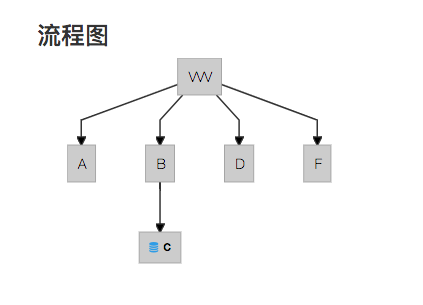
Demo
这里直接上一个简单的demo,说明下
Show me the code
<div class="container">
    <div class="col-sm-6">
        <svg width=960 height=400>
            <g/>
        </svg>
    </div>
</div>
 let svg = d3.select("svg"),
            inner = svg.select("g");

        // Create the input graph
        this.g = new dagreD3.graphlib.Graph({});
        // Set an object for the graph label
        this.g.setGraph({});
        // Default to assigning a new object as a label for each new edge.
        this.g.setDefaultEdgeLabel(function () {
            return {};
        });
        this.g.graph().transition = function (selection) {
            return selection.transition().duration(500);
        };

        // 缩放功能实现
        var zoom = d3.behavior.zoom().on("zoom", function () {
            inner.attr("transform", "translate(" + d3.event.translate + ")" +
                "scale(" + d3.event.scale + ")");
        });
        svg.call(zoom);

        this.g.setNode(0, {label: 'VVV'});
        this.g.setNode(1, {label: "A"});
        this.g.setNode(2, {label: "B"});
        this.g.setNode(3, {labelType:"html",label: "<i class=\"fa fa-database\"></i>B"});

        this.g.setEdge(0, 1);
        this.g.setEdge(0, 2);
        this.g.setEdge(2, 3);

        // Run the renderer. This is what draws the final graph.
        this.render(inner, this.g);


        this.g.nodes().forEach((v) => {
            let node = this.g.node(v);
            console.log(`Node ${v}: Label:${node.label},X:${node.x},Y:${node.y}`);
        });

        //give IDs to each of the nodes so that they can be accessed
        svg.selectAll("g.node rect")
            .attr("id", function (d) {
                return "node" + d;
            });
        svg.selectAll("g.edgePath path")
            .attr("id", function (e) {
                return e.v + "-" + e.w;
            });
        svg.selectAll("g.edgeLabel g")
            .attr("id", function (e) {
                return 'label_' + e.v + "-" + e.w;
            });


        this.g.nodes().forEach((v) => {
            var node = this.g.node(v);
            node.customId = "node" + v;
        });
        this.g.edges().forEach((e) => {
            var edge = this.g.edge(e.v, e.w);
            edge.customId = e.v + "-" + e.w
        });

        // code for drag
        function dragstart(d) {
            d3.event.sourceEvent.stopPropagation();
        }

        let dragmover = (currentThis, d) => {
            this.dragmove(currentThis, d);
        };

        function dragmove(d) {
            dragmover(this, d)
        }

        let nodeDrag = d3.behavior.drag()
            .on("dragstart", dragstart)
            .on("drag", dragmove);

        let edgeDrag = d3.behavior.drag()
            .on("dragstart", dragstart)
            .on('drag', (d) => {
                this.translateEdge(this.g.edge(d.v, d.w), d3.event.dx, d3.event.dy);
                $('#' + this.g.edge(d.v, d.w).customId).attr('d', this.calcPoints(d));
            });

        nodeDrag.call(svg.selectAll("g.node"));
        edgeDrag.call(svg.selectAll("g.edgePath"));
主要函数
用法,建议直接看d3-dagre源码,这样不会有漏,这里列举下主要函数:
- 添加节点
setNode(v, {label: 'VVV'}) - 添加边
setEdge(v, s) - 删除节点
removeNode(v) - 删除边
removeEdge(v,s)
拖拽、缩放功能其实是通过D3实现,方法如上,如果想实现单击节点或者边,右键菜单,可以通过JQ来实现,比如该插件jQuery-contextMenu